FRONTKN (0128) - FRONTKN -Could It Be Another Heart Wrenching Stock like INARI? -YiStock
Author: YiStock |
Publish date: Sat, 25 Apr 2015, 10:29 AM

I must admit this: I was prejudice about Frontken Corporation, being a
small new player in "technology" industry (i assumed since the weight of
semi-con related business is gaining weight), which not enough to
trigger my interest to look into their financial, untill i read the news
by The Edge pertaining to Ares Green Technology Corporation + Frontken.
This spark my interest to look into this company's financial.
Personally, i'm impressed and hopeful for Frontken, be it share price or
the upcoming value, that potentially bring about by the company.
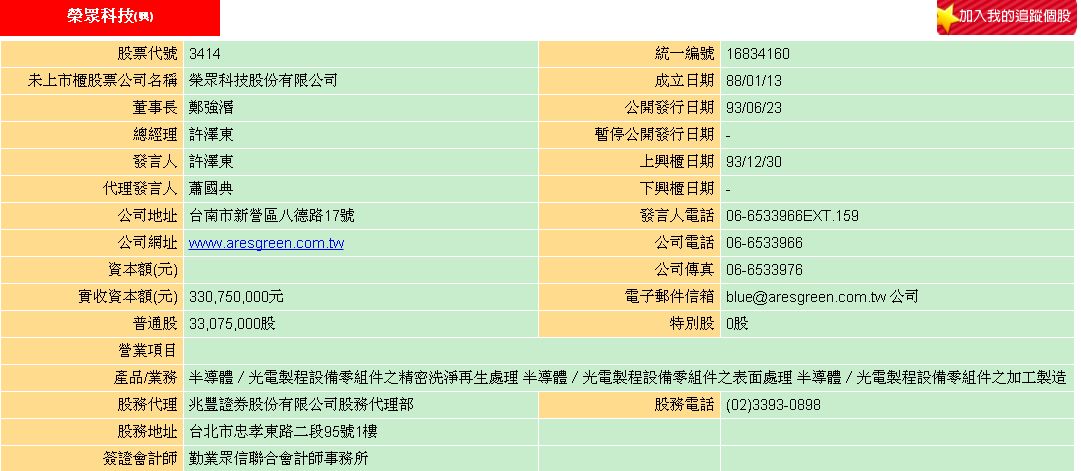
I did a search on net about this company, Ares Green Technology
Corporation in Taiwan. Whoever interested to know more about this
company can click here: http://www.aresgreen.com.tw/ . Specially invite
readers to go into the investor relation to look into the annual report
to understand more about the biz. It did shows the link between Ares
Green and other giant semi-conductor companies in Taiwan which, in turn,
link to smart devices like iphone and etc. Frontken is now major
shareholder in Ares Green (about 58%).
(http://www.theedgemarkets.com/my/article/frontken-much-9-sees-continued-interest-apple-chip-demand).
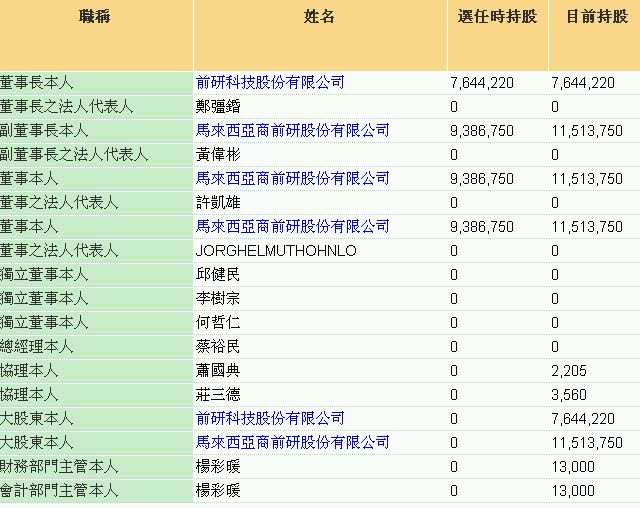
Readers may also find the institutional investors that was in
Frontken's shareholder list, and maybe still, up to today.
Let look at company financial from year 2009 till year 2014 (latest audited report figures included):
| 12/31/09 |
12/31/10 |
12/31/11 |
12/31/12 |
12/31/13 |
12/31/14 |
| 137,358,860 |
146,703,790 |
198,122,512 |
181,304,515 |
190,611,437 |
309,845,116 |
| 2. Operating Profit Before Tax (NOPBT) |
| 8,103,178 |
13,103,388 |
2,999,034 |
3,238,125 |
5,910,807 |
28,139,842 |
| 3. Net Operating Profit After Tax (NOPAT) |
| 7,843,894 |
12,102,850 |
3,484,076 |
4,175,169 |
464,679 |
23,188,120 |
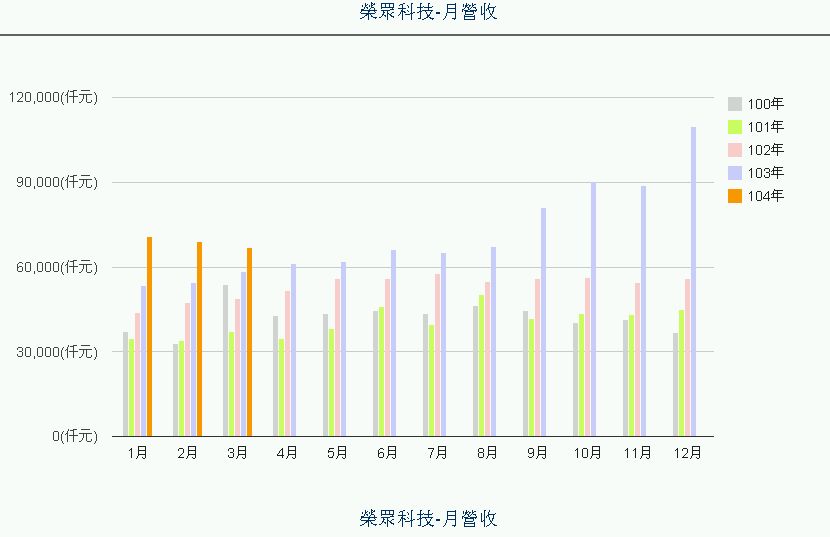
>> Notable the good growth in Revenue, NOPBT and NOPAT.
Except for year 2013 of low NOPAT due to one off combined big tax
expenses of RM 5.45 million resulting from disposing subsidiary
companies. From 2014 onward, all above, hopefully should propel higher
especially contribution from Taiwan.
-----------------------------------------------------------------------------------------------------------------------------------------
| 713,749,118 |
956,780,244 |
1,010,922,408 |
1,009,573,358 |
1,009,568,105 |
1,008,914,190 |
| 5. Share Price 31 December |
| 0.23 |
0.17 |
0.12 |
0.08 |
0.08 |
0.14 |
| 164,162,297 |
162,652,641 |
121,310,689 |
80,765,869 |
80,765,448 |
141,247,987 |
| 250,075,564 |
259,499,209 |
221,375,241 |
140,477,758 |
-133,461,598 |
194,969,042 |
>> Better value but not reflected in price!
-----------------------------------------------------------------------------------------------------------------------------------------
| 8. Total Non Current Asset |
| 168,234,261 |
211,563,318 |
214,176,867 |
183,605,641 |
171,779,183 |
173,018,976 |
| 66,761,954 |
121,628,199 |
119,410,925 |
130,572,555 |
129,463,816 |
183,363,025 |
| 234,996,215 |
333,191,517 |
333,587,792 |
314,178,196 |
302,158,000 |
356,382,001 |
| 11. Non-Current Liability |
| 43,650,998 |
62,571,959 |
55,614,082 |
32,095,554 |
29,483,781 |
27,957,688 |
| 55,814,605 |
68,474,398 |
70,811,879 |
69,073,866 |
58,447,365 |
88,707,361 |
| 99,465,603 |
131,046,517 |
126,425,961 |
101,169,420 |
87,931,146 |
116,665,049 |
| 63,104,940 |
75,102,500 |
78,131,354 |
83,751,635 |
85,162,494 |
105,663,068 |
| 135,530,612 |
202,145,160 |
207,161,830 |
213,008,776 |
214,227,046 |
239,716,952 |
>> In healthy stage.
----------------------------------------------------------------------------------------------------------------------------------------------
| 14. Net Cash from Operating Activity |
| 23,277,903 |
20,919,296 |
24,587,291 |
16,042,623 |
36,680,837 |
40,672,050 |
| 15. Cash and Cash Equivalent at the end of period |
| 10,186,974 |
32,969,666 |
32,969,666 |
24,691,788 |
36,413,816 |
52,575,148 |
>> Smooth flow-in of Cash!
----------------------------------------------------------------------------------------------------------------------------------------------
MY FINANCIAL ANALYSIS:
| DUPONT's ROE (%) |
5.79% |
5.99% |
1.68% |
1.96% |
0.22% |
9.67% |
>> Getting Better net margin and ROA. Financial leverage remained below 1.5
| Return of Asset (%) |
3.34% |
3.63% |
1.04% |
1.33% |
0.15% |
6.51% |
>> Improving
| Return of Invested Capital (ROIC) (%) |
5.48% |
5.39% |
1.53% |
2.03% |
0.25% |
12.87% |
>> Above 10%
| Earning Yield (Magic Formula) (%) |
4.79% |
6.22% |
2.62% |
4.35% |
-5.52% |
15.06% |
>> Improving
| PE Ratio using Magic Formula |
20.87 |
16.09 |
38.15 |
23.00 |
-18.13 |
6.64 |
>> i Missed the boat of "cheapness"
| Asset Turn Over |
0.5845 |
0.5164 |
0.5943 |
0.5598 |
0.6185 |
0.9410 |
>> Excellent!
| Debt To Equity Ratio |
0.73 |
0.65 |
0.61 |
0.47 |
0.41 |
0.49 |
>> Good!
| Receivable Turn Ratio (days) |
112 |
143 |
137 |
152 |
144 |
108 |
>> Improving
| Inventories Turn Over (times per year) |
11.39 |
10.19 |
13.55 |
12.45 |
11.42 |
20.13 |
>> Gaining speed!
| Cash return on Invested Capital |
13.90% |
-1.33% |
0.92% |
2.08% |
16.69% |
17.88% |
>> Excellent!
| Free Cash Flow (FCF) to Revenue |
14.48% |
-2.03% |
1.06% |
2.36% |
16.44% |
10.39% |
>> Excellent!
| Free Cash Flow (FCF) |
19,885,951 |
-2,983,834 |
2,098,858 |
4,273,403 |
31,344,298 |
32,202,002 |
>> Net money from operation flow in steadily.
| Inventories Over Revenue |
6.50% |
7.11% |
5.74% |
6.17% |
7.17% |
3.32% |
| Net Receiveable Over Revenue (%) |
30.71% |
49.39% |
38.76% |
40.69% |
40.16% |
34.57% |
| Revenue Over Capex |
40.50 |
6.14 |
8.81 |
15.40 |
35.72 |
36.58 |
| Net Income Over CAPEX |
2.31 |
0.51 |
0.15 |
0.35 |
0.09 |
2.74 |
| Capex Requirement (%) per dollar net earning |
43.24% |
197.50% |
645.46% |
281.89% |
1148.44% |
36.53% |
| Graham Net Nets Current Asset Value (NCAV) |
-0.0458 |
-0.0098 |
-0.0069 |
0.0291 |
0.0411 |
0.0661 |
| Graham Net Nets Working Capital (NNWC) |
-0.0698 |
-0.0390 |
-0.0364 |
0.0012 |
0.2758 |
0.0315 |
| Current Asset to Total Asset |
28.41% |
36.50% |
35.80% |
41.56% |
42.85% |
51.45% |
>> All improving!
MY VALUATION:
1. At current share price of RM 0.29,
- the share is traded at EY of 8.48%. The PE (derived from magic formula) is traded at 11.8 times of FY 2014 earning only. I would say it is still cheap if would to include potential from Taiwan. [The Edge, Frontkn PE @ 16.2]
2. To compared the PE with some semi-con and technology companies (my own assumption and figures direct from The Edge financial dash board, fundamental above 2.0 choosen)
Inari - 18.88 times; fundamental 2.7; market cap 2.45
Gtronic- 26.64; fundamental 3.0; market cap 1.72B
JCY - 11.59; fundamental 2.1; market cap 1.62B
SKP Resources - 24.5; fundamental 2.1; market cap 0.95B
Vitrox - 17.8; fundamental 3.0; market cap 0.87B
Average PE is about 20 x.
- therefore,
Frontkn is possibily traded at 0.37 (0.0186 x 20) <= Optimistic (MY TP1)
Frontkn is possibily traded at 0.53 (based on my PE calculation) <= a little too optimistic! (MY TP2)
3. To compared the PE among the peer within same category, based on The Edge Financial Dash Board
UEM edgenta - 28.77; fundamental 2.1; market cap 2.9B
Progressive impact - 15.96; fundamental 2.4, market cap 0.16B
Ideal suncity - 15.94; fundamental 3.0, market cap 0.089B
(a) Average PE above three is about 20x,
- therefore share price is possibily traded at 0.37 <= Optimistic (MY TP1)
- share price is possibily traded
at 0.53 (based on my PE calculation) <= a little too optimistic! (MY TP2)
(b) Average PE of 2 similar small market cap above, average PE is 15.95
- therefore current share price of 0.29 has probably reflected its current state of value.
3. Market Value (Share Price) Generation per $ EPS Retained
| -2.40 |
-4.00 |
-4.79 |
-5.17 |
-1.89 |
- All figures are in negatives, clearly it has been neglected for long time! What are the reasons, i dont know..
If i would to put in current share price of 0.29,
| -2.40 |
-4.00 |
-4.79 |
-5.17 |
1.26 |
- It turns positive!
Of course, only GOD knows the future, human don't. Our duty is to keep
an eye on company's fundamental, from time to time. After all, price
should reflect its value.
Happy investing!
YiStock
Note: This is not a recommendation to buy or sell or trade above
mentioned stock! It is for sharing purposely of what i am doing.
Add on:
http://klse.i3investor.com
